Measuring peace
First results from the Global Peace Activation: a continuous measure of collective peace built from wearable heart data and journaled emotion.
- We built a way to measure how at peace a group of people is from their wearable heart data and the emotions they log in a journal. We call it the Biometric Peace Index (patent pending).
- On August 8th, participants across six continents shared that data with us while thousands of people meditated together for the same 30 minutes.
- During the meditation their hearts slowed, their bodies calmed, and what they wrote turned sharply more positive. The index hit its highest point of the entire day during the meditation and stayed near it for about two hours afterwards.
- Where we want to take it is a live measure of how a community, a city, or a country is doing, so that leaders can see how their decisions and the events around them affect the people they serve, and use that to make better policy.
On August 8th, 2026, the Global Peace Activation ran a 24-hour livestream with a synchronized 30-minute meditation at 07:00 UTC, across 62 gathering sites. 83 participants consented to share their data with us for research: 35 had a wearable recording beat-to-beat heart data, and 44 logged emotions in the IN TRUTH app. Home countries spanned six continents.
We used the event to build and test a prototype of something we've wanted for a while: a continuous measure of how at peace a group of people is, derived from their physiology and their own words. This post covers how the Biometric Peace Index (patent pending) works, what we saw during the event, and what we need next.
How the index works
Heart rate and HRV alone can't tell you what emotion someone is feeling. They index arousal, meaning how activated the nervous system is, but a calm, content state and a calm, low state look nearly identical on a wrist sensor. What people write does carry that information. So the index combines the two: autonomic physiology for arousal, journaled emotion labels for valence.
One design choice matters more than the rest. Every reading is normalized within person, against that person's own history at the same time of day. We never compare one person's heart rate to another's.
Physiology sets the vertical axis
We pull heart rate and RMSSD (a vagal-tone HRV measure) from the wearable in 5-minute segments and aggregate to 30-minute windows. Each window is compared to a pool of the same person's windows at the same local clock time on ordinary days, and scored as a percentile: calmer than X% of your usual moments at this hour. This removes between-person, between-device and circadian differences in one step.
Journaled emotion sets the horizontal axis
Each label in the app's emotion taxonomy (gratitude, frustration, joy, exhaustion) has fixed valence and arousal coordinates, so we only need the labels and never read the free text. We pool labels into 60-minute windows and fit a Gaussian process to interpolate between them. Uncertainty grows when nobody is journaling.
Peace is a direction on the map
Together the two axes form the circumplex, and every emotion has a location on it. Excitement is pleasant and high-arousal. Feeling drained is low-arousal and unpleasant. Neither is peace. We define peace as the calm-and-pleasant direction, and the index as the projection of a moment onto that diagonal, scaled 0 to 100. 50 is an ordinary moment.
Three examples
The projection is what makes the index specific. Excitement and stress are both far from an ordinary moment, but in different directions, and only one of them is toward peace.
A stressful day
The body is activated and the words are unpleasant. Deep in the tense corner, near the bottom of the peace line.
A celebration
Pleasant words, but an activated body. Excitement isn't peace, so it scores like an ordinary moment.
A meditation
A calm body and pleasant words. Far along the peace line.
Try it
Drag the dot to set a moment's arousal and valence, or play the sequence from activation day. The coral point is where the moment projects onto the peace diagonal.
Results
Heart rate dropped during the meditation
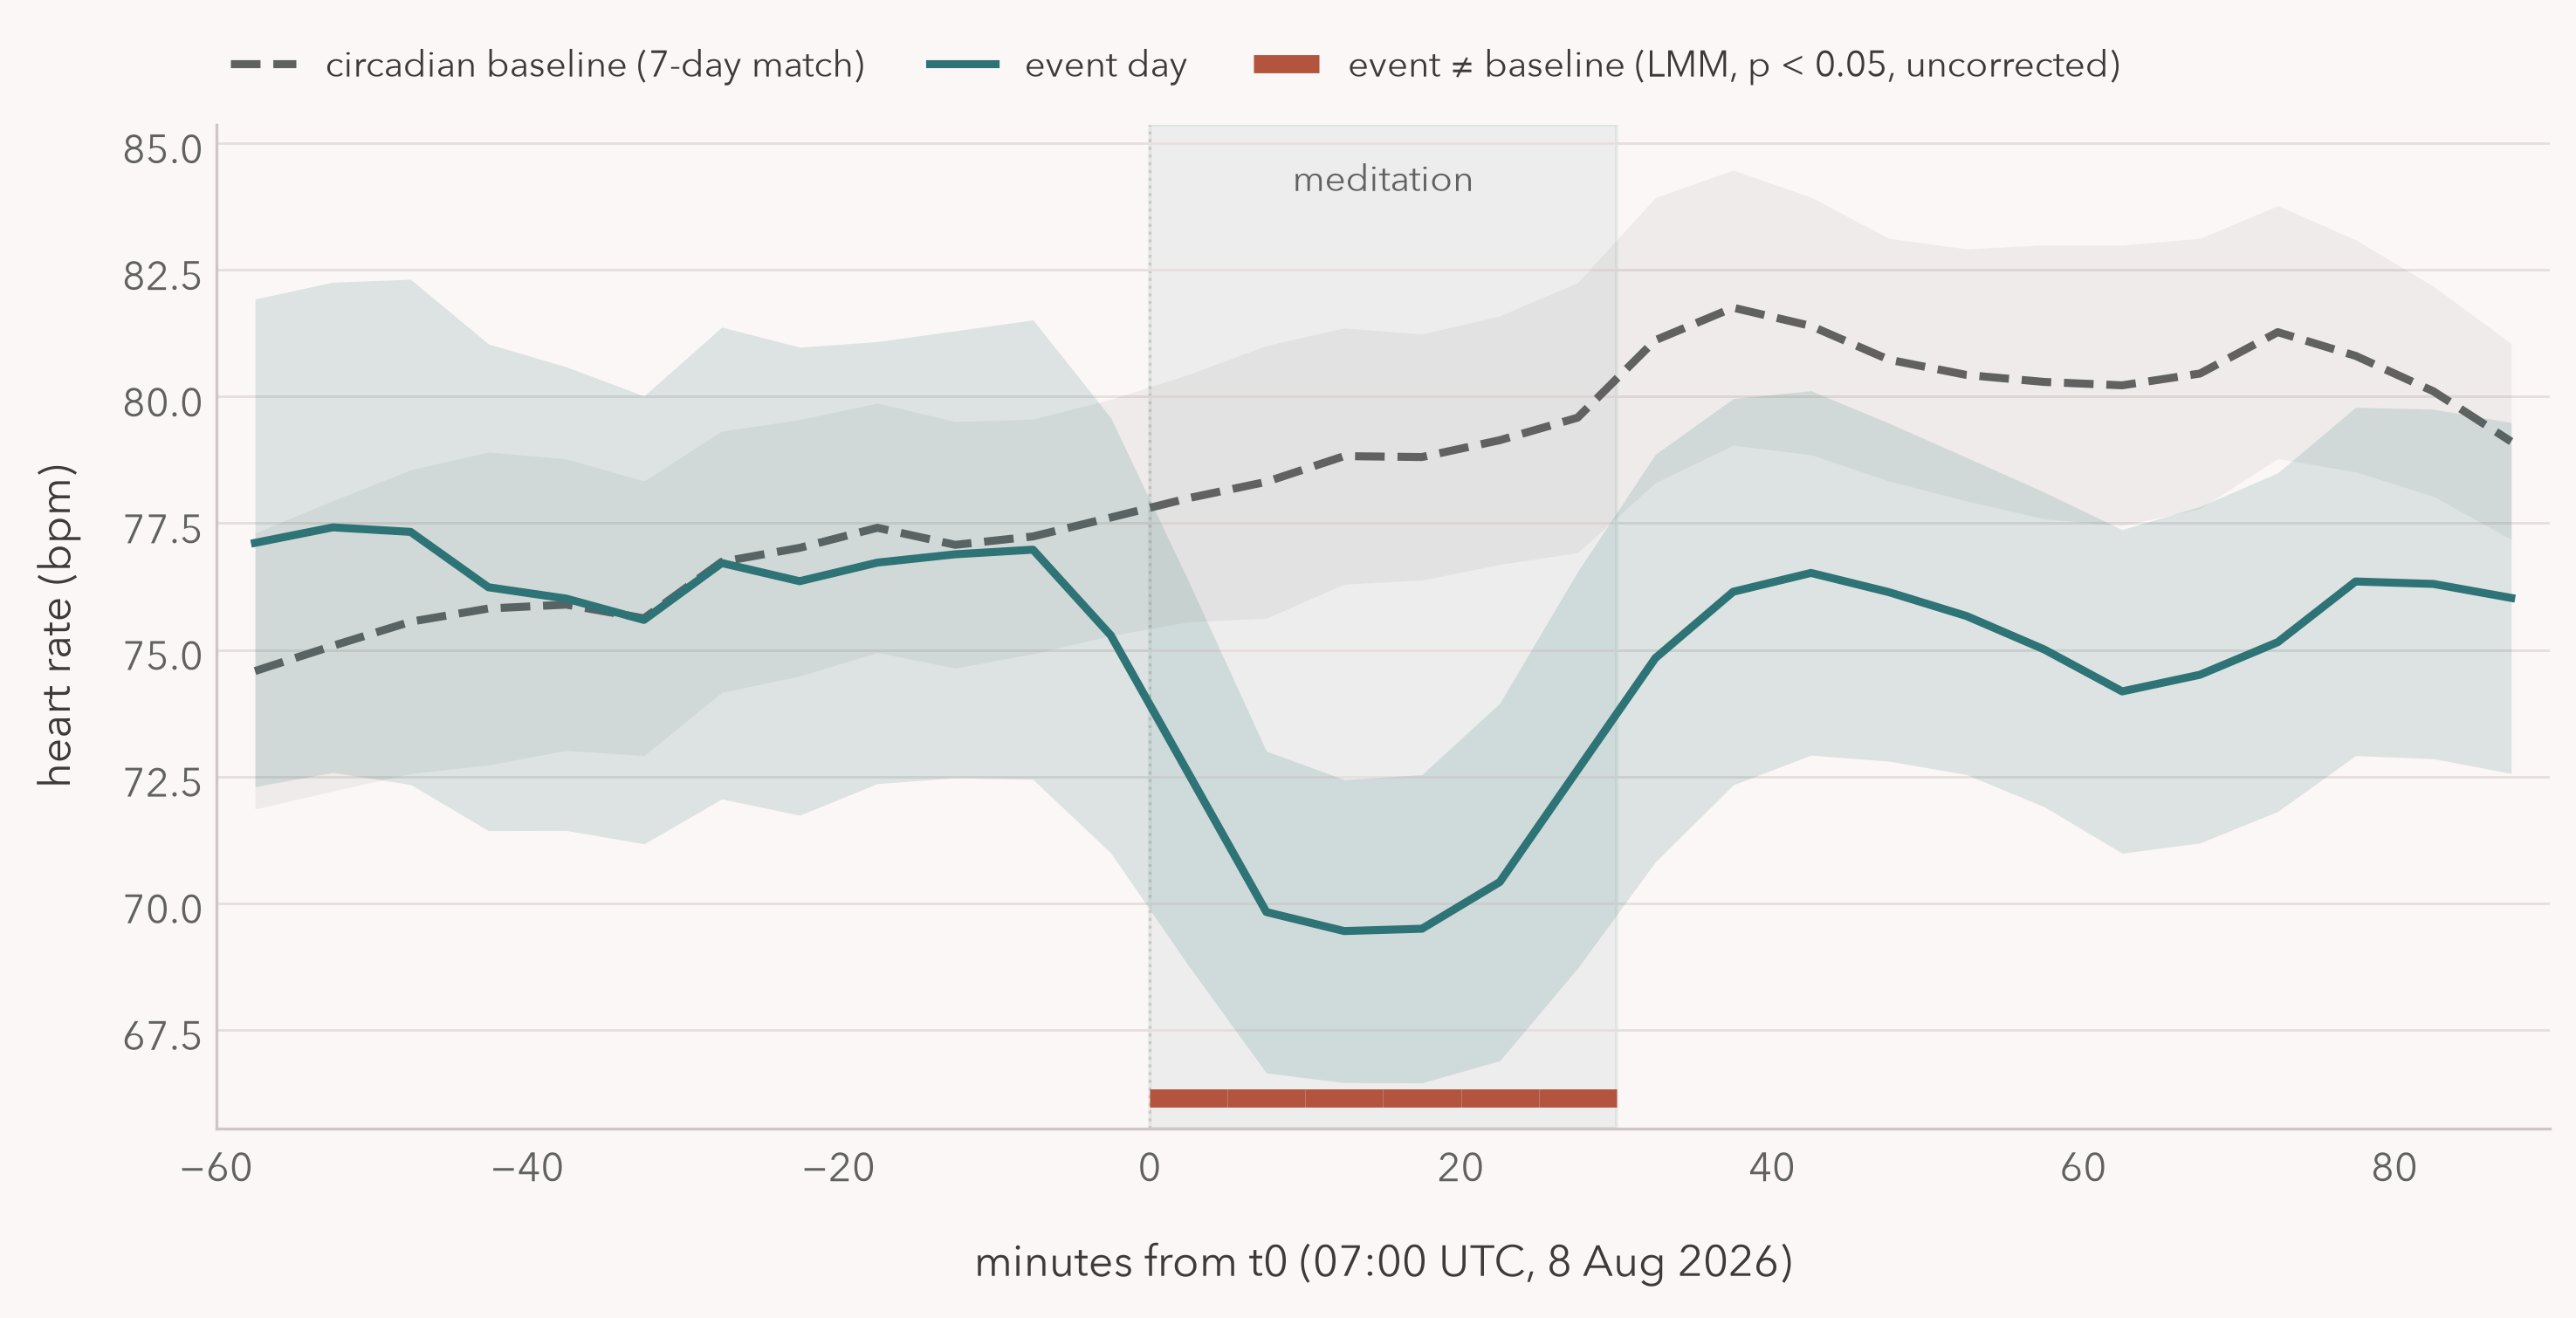
Cohort heart rate follows its 7-day circadian baseline until 07:00 UTC, then drops. Mid-meditation it is about 9 bpm below where the same participants normally sit at that hour (linear mixed model, window level: −9.4 bpm, 95% CI −16.5 to −2.3, p = .009). Recovery is slow: heart rate is still below baseline an hour later. There is no anticipatory change in the hour before.
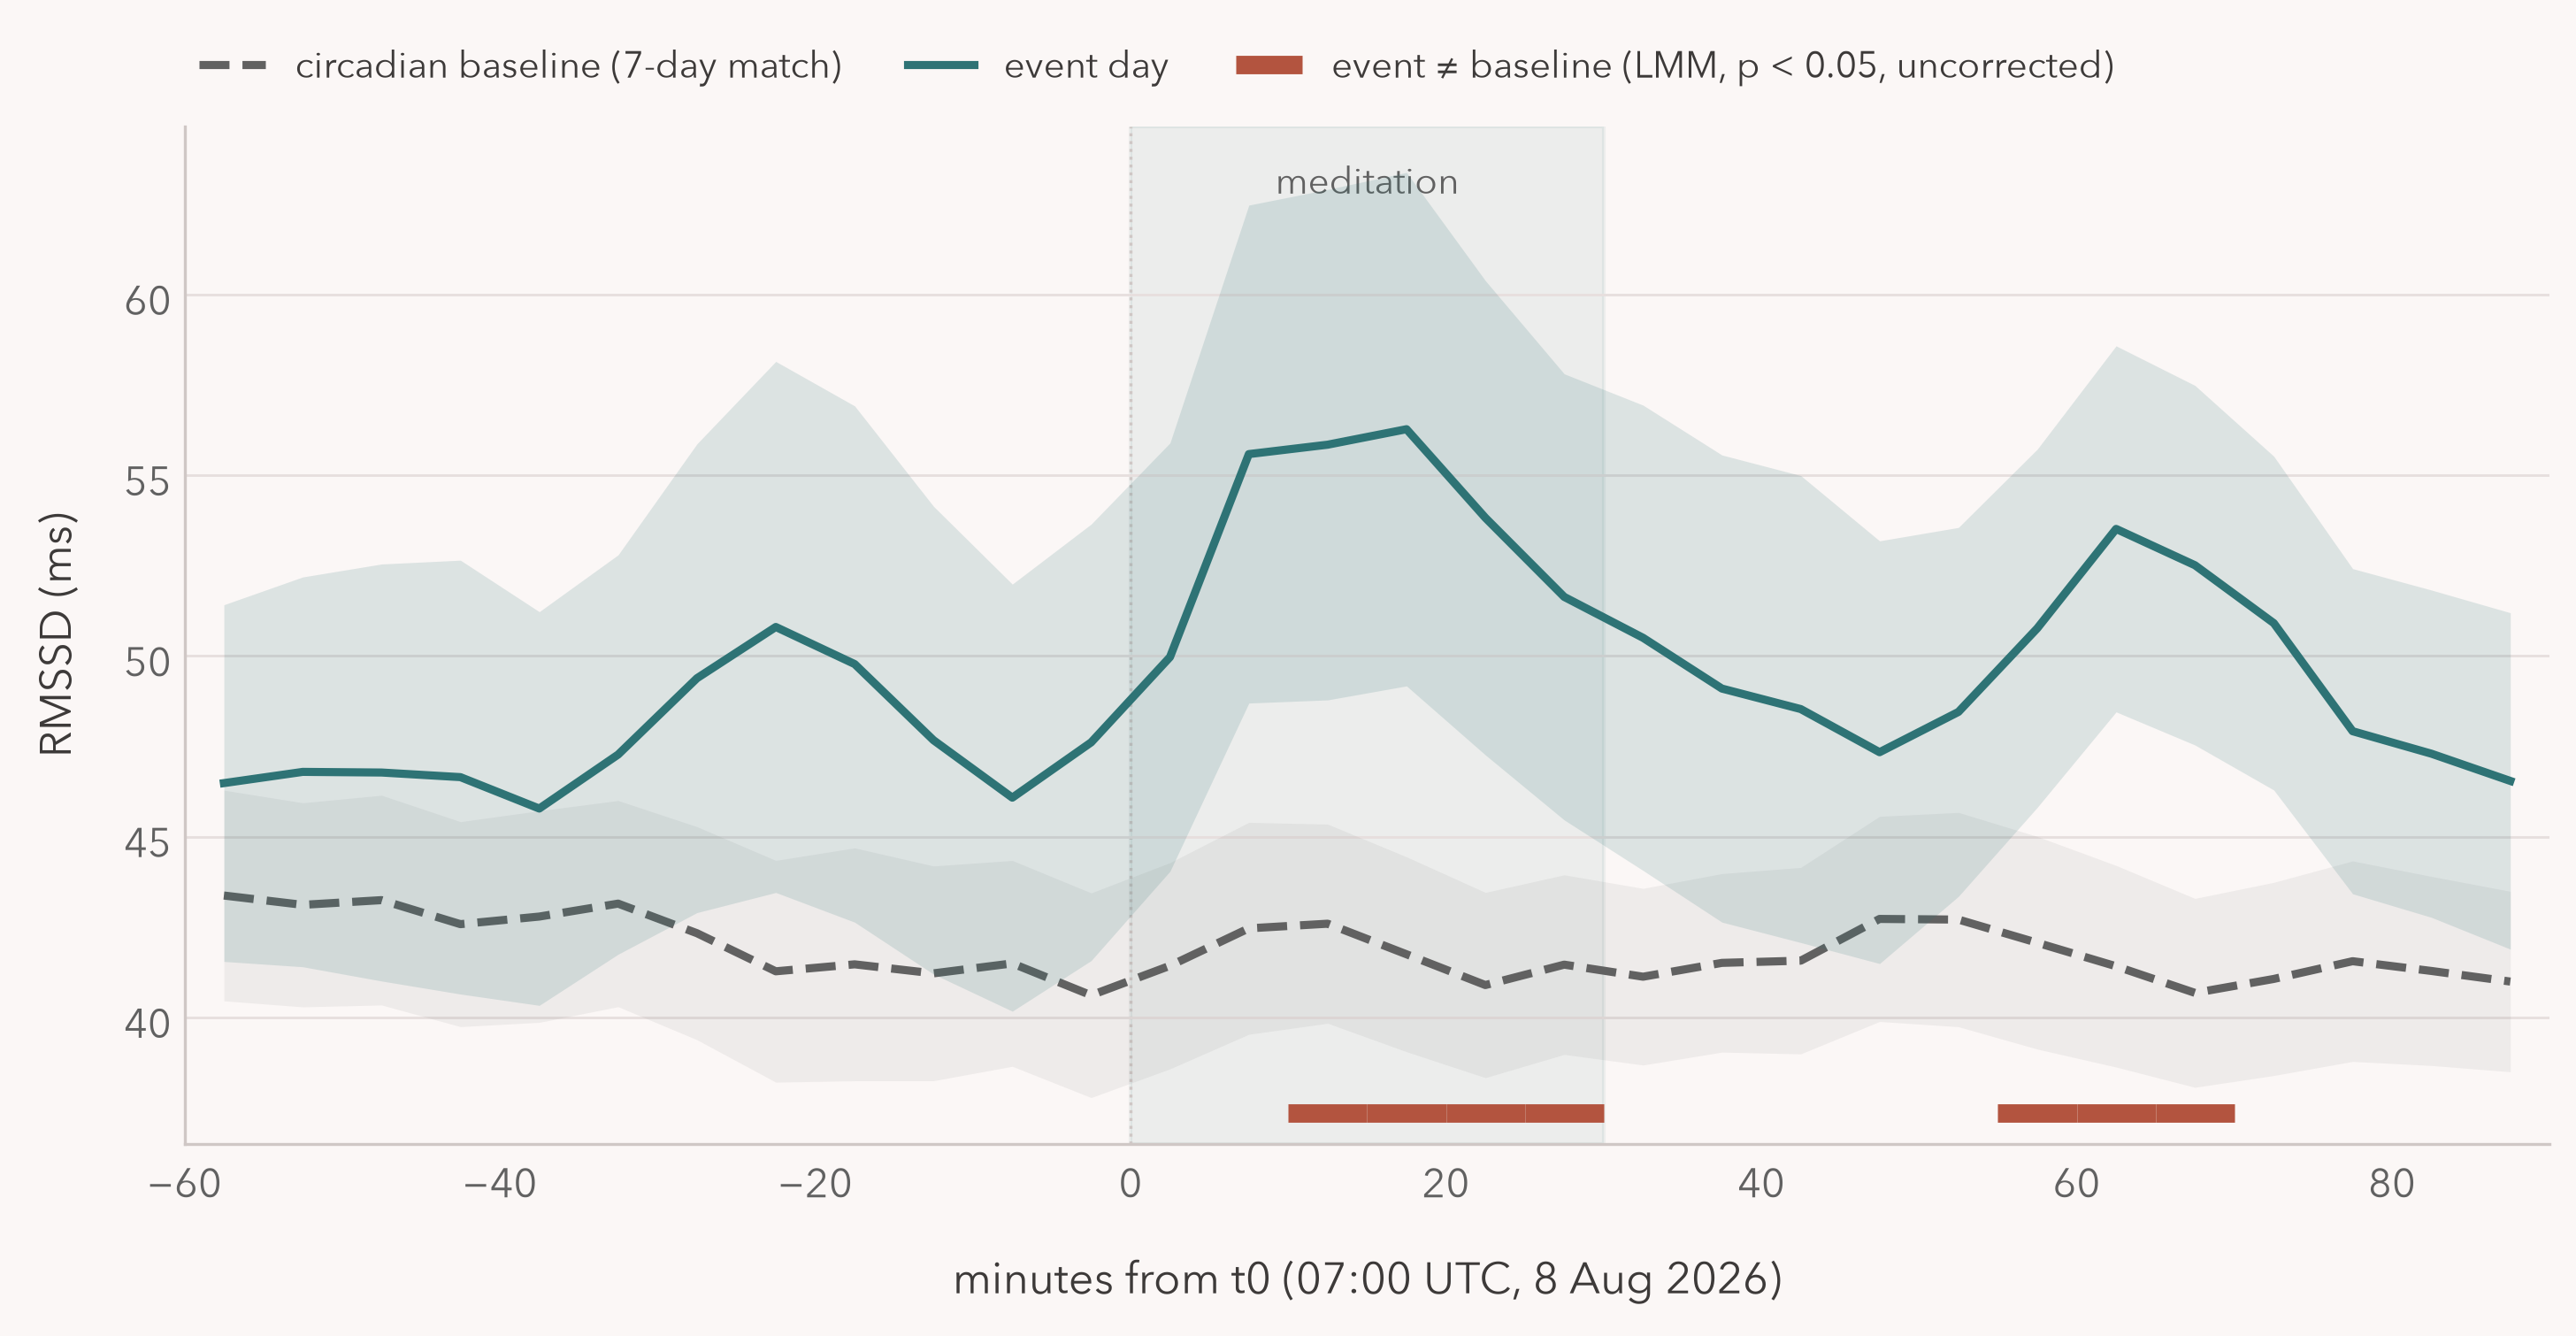
RMSSD rises 10 to 20% above baseline during the meditation, consistent with a parasympathetic shift rather than sleep. The window-level estimate (+15%) is not significant at this sample size, though the strongest mid-meditation bins survive FDR correction. I'd call the HRV result suggestive, not established.
Journaled emotion shifted toward pleasant for one day
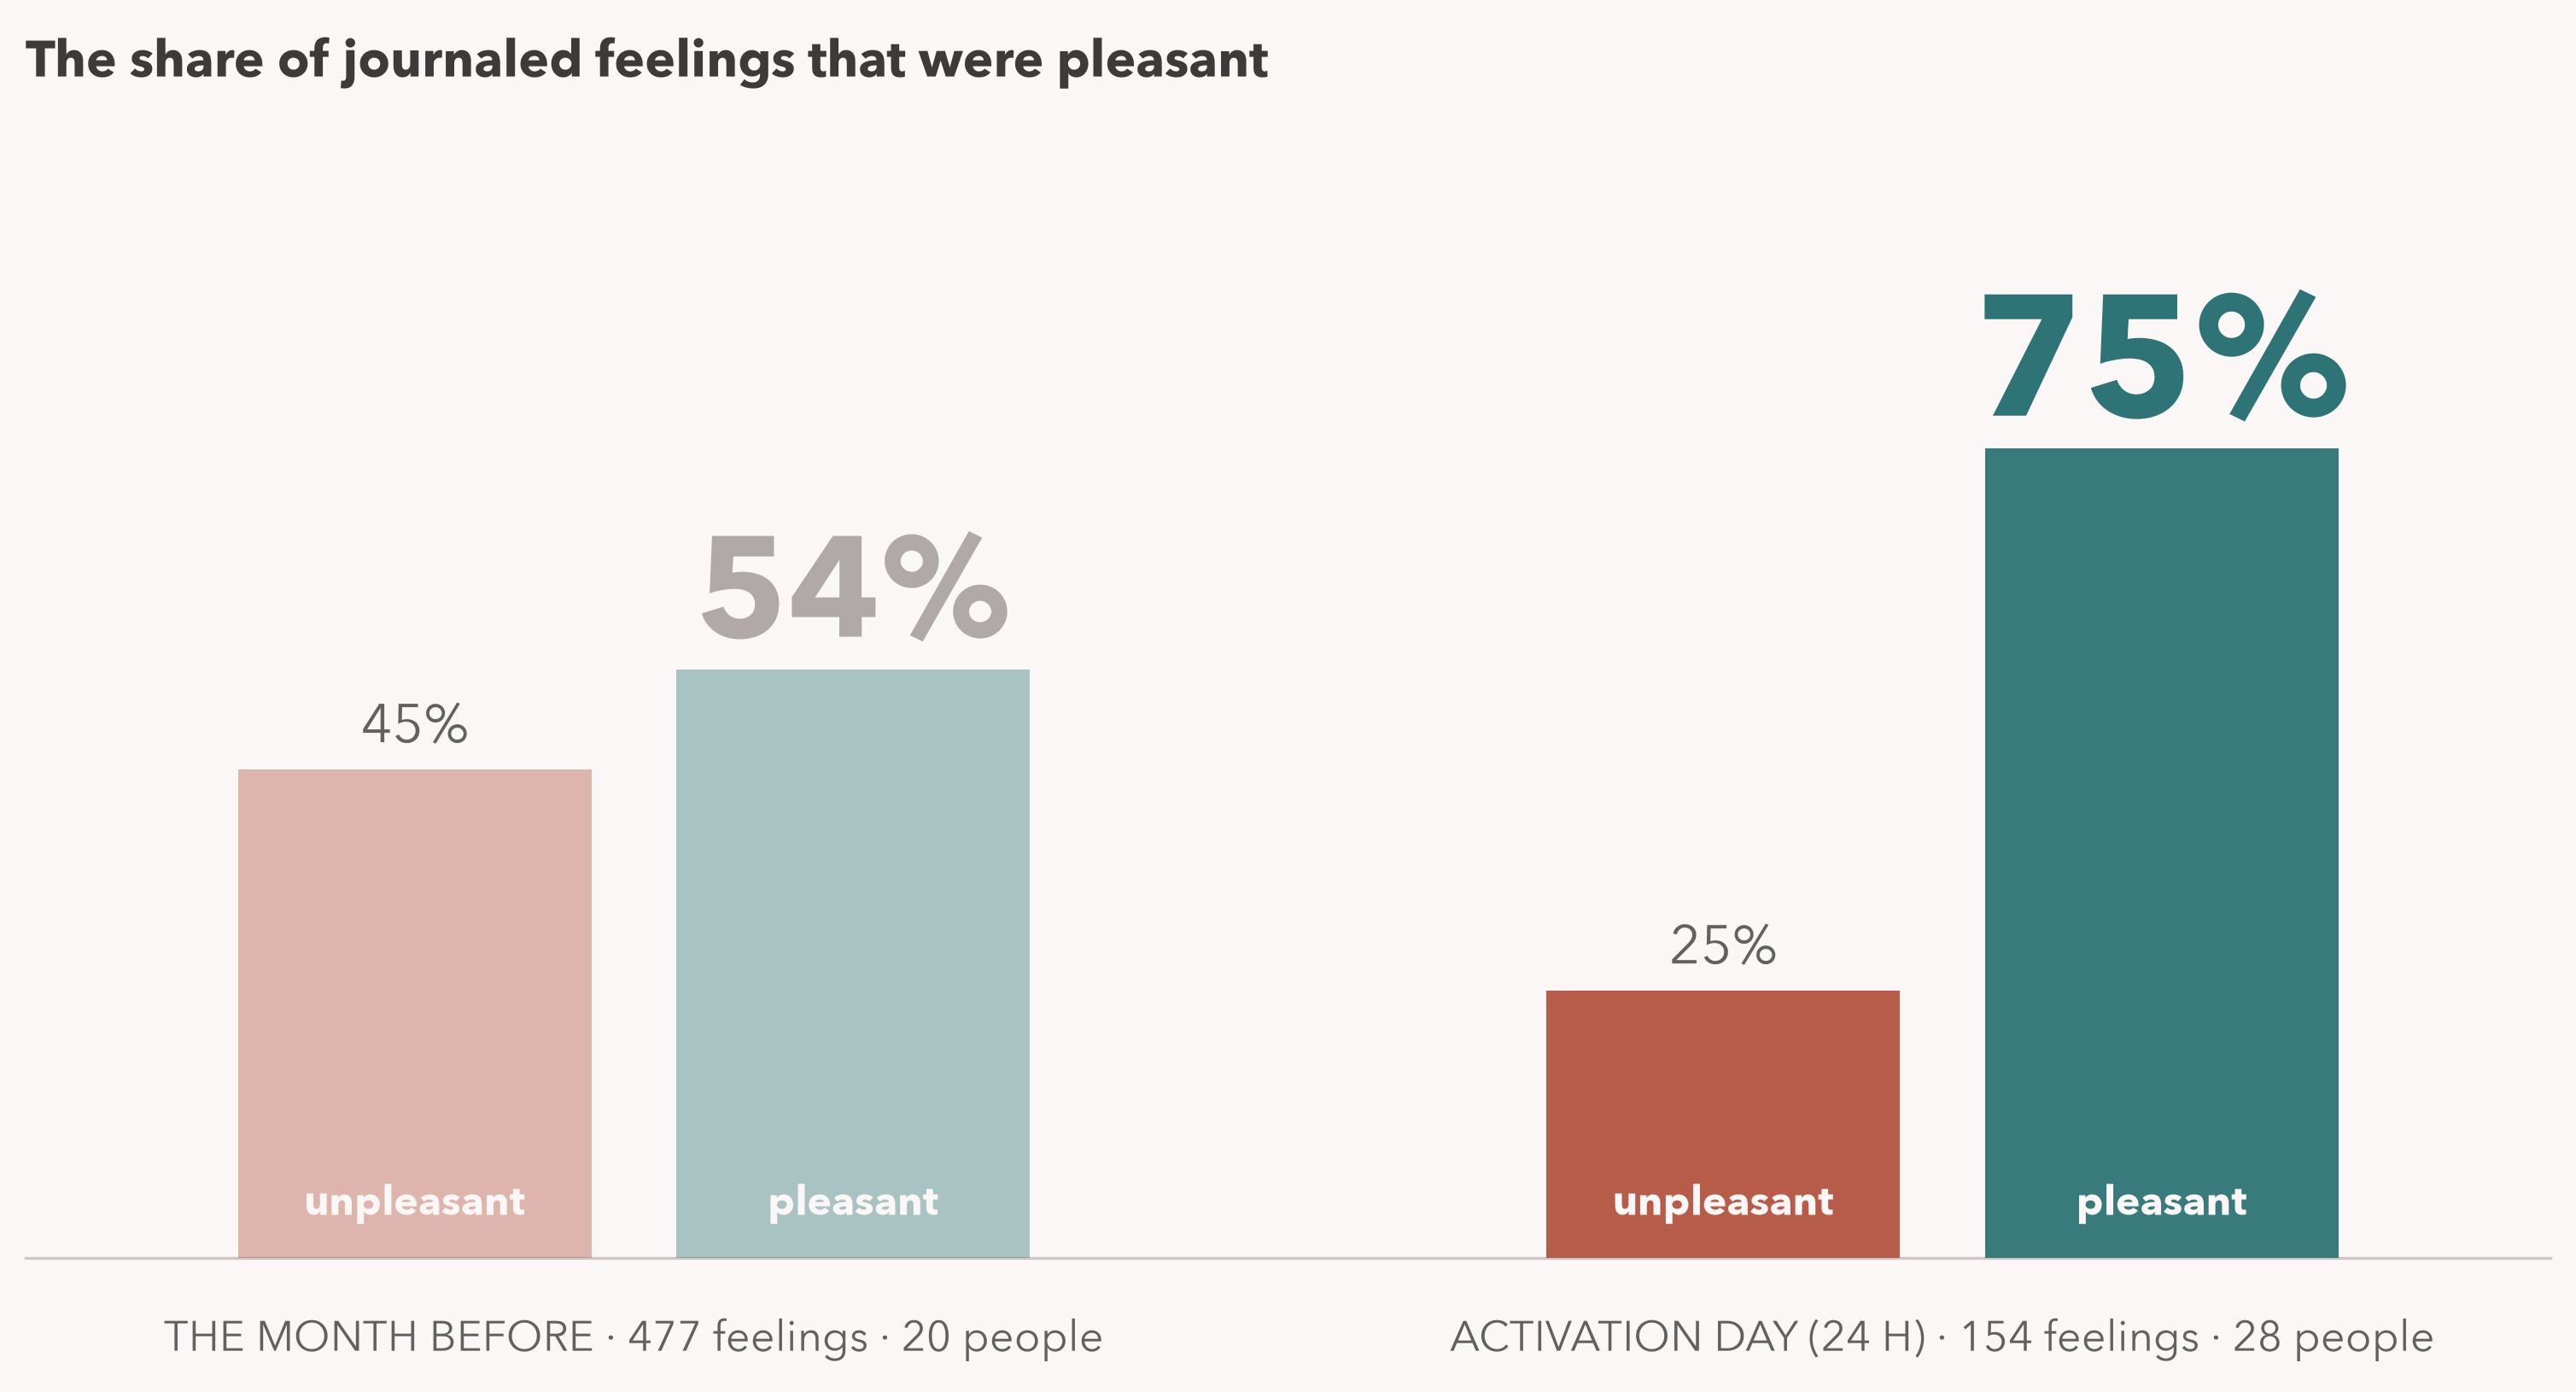
In the month before the event, 54% of journaled emotions were pleasant. On activation day it was 75%, and in the two hours around the meditation, 83%. Unpleasant labels (frustration, exhaustion, anxiety) went from 45% to 25% of what people logged. By the following week the mix was back to baseline.
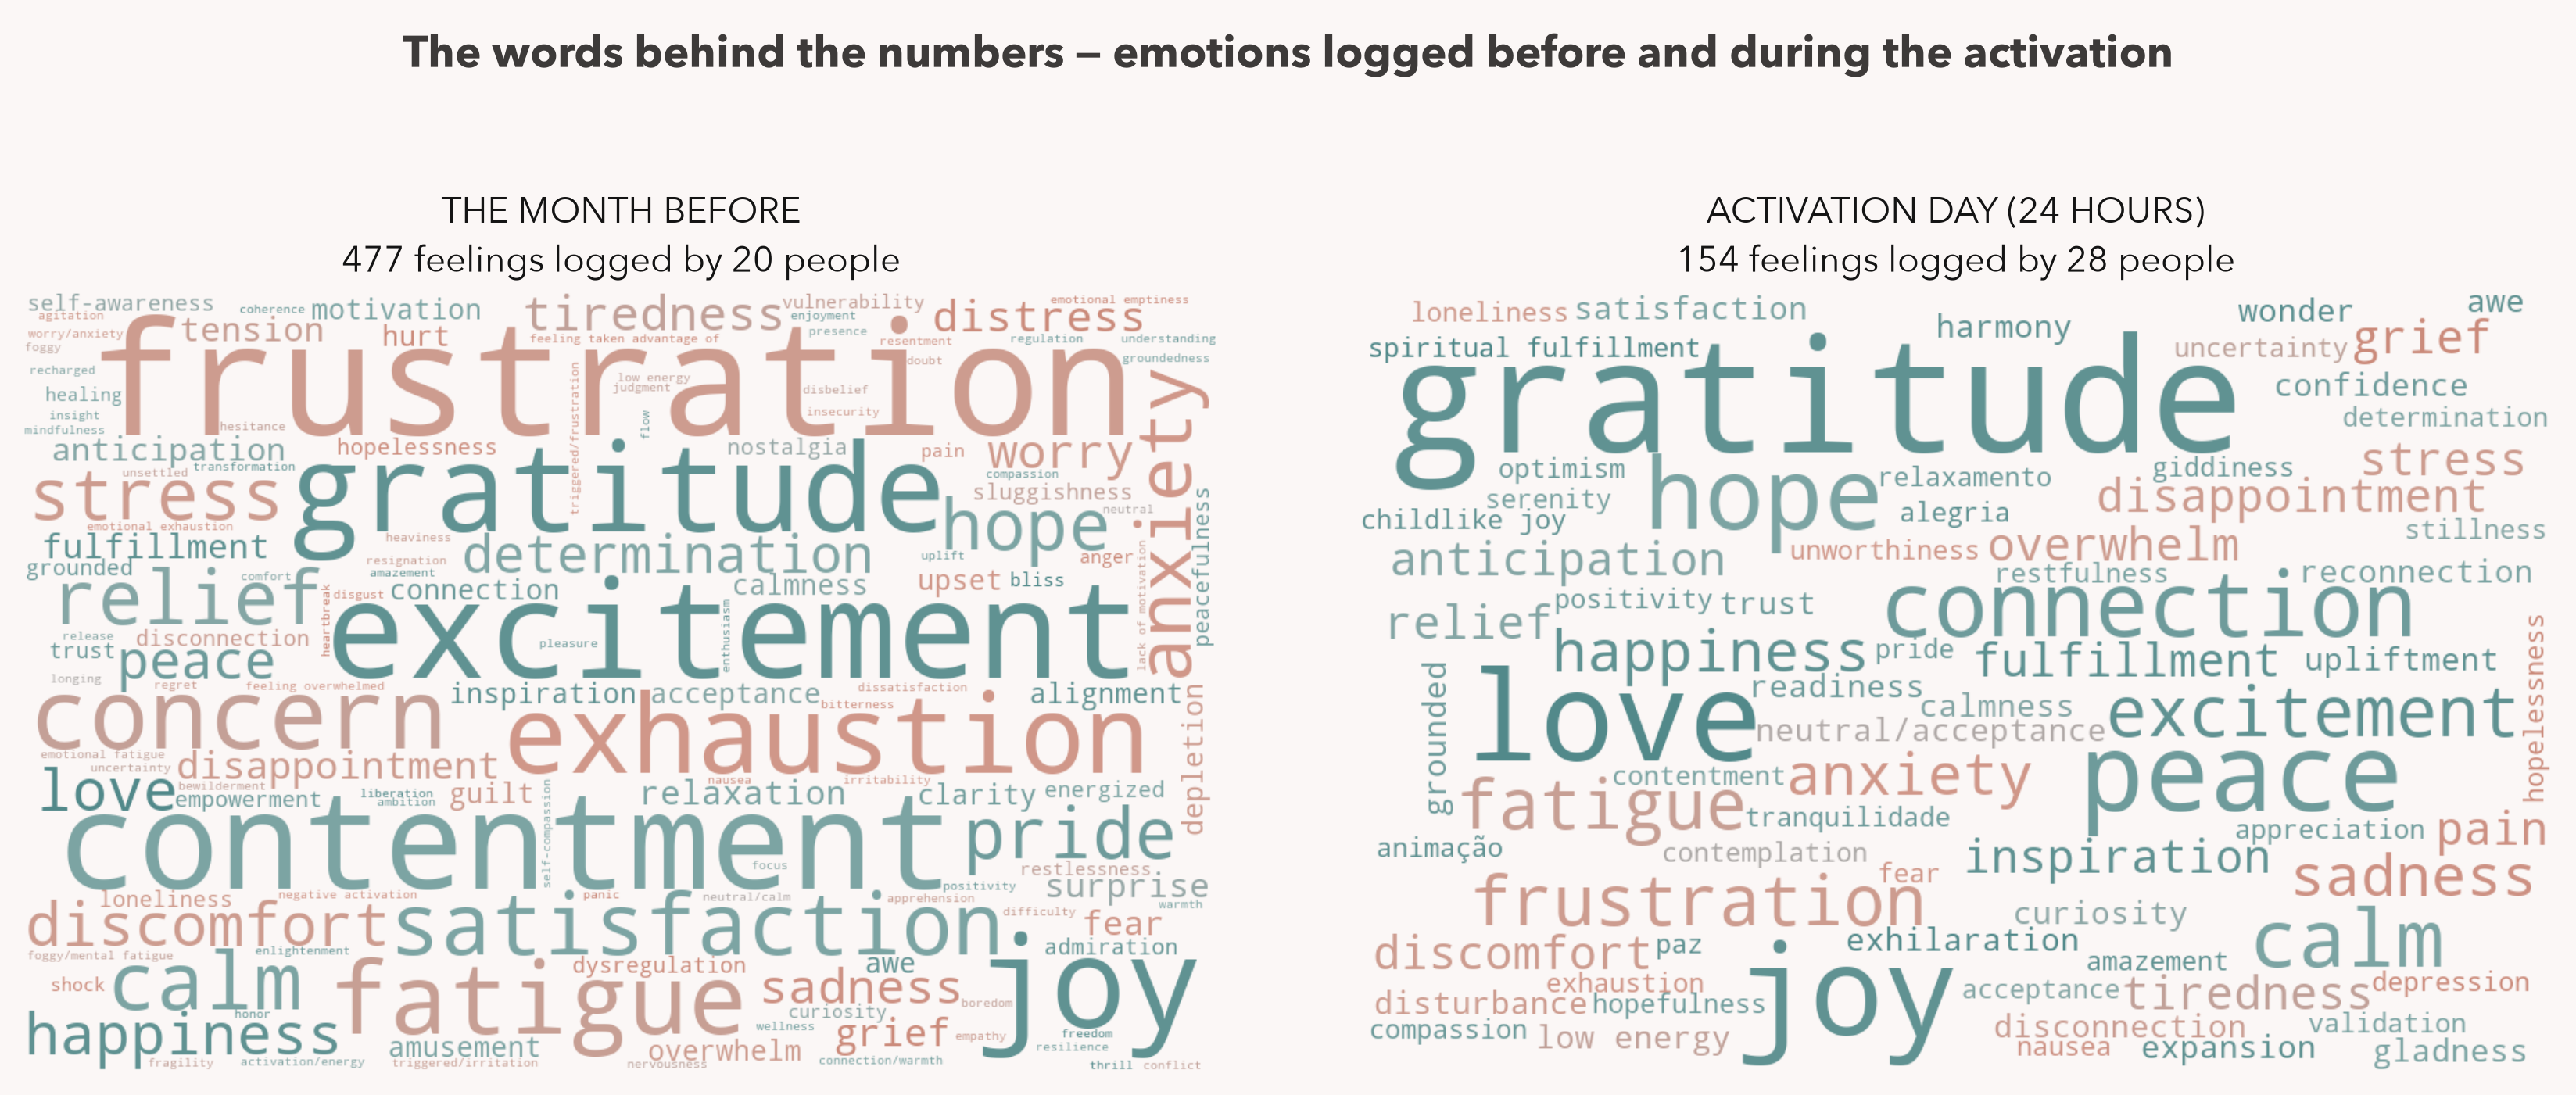
The most common labels on activation day were gratitude, love, joy and hope. Peace and connection increased several-fold as a share of labels compared with ordinary days. Entries came in several languages.
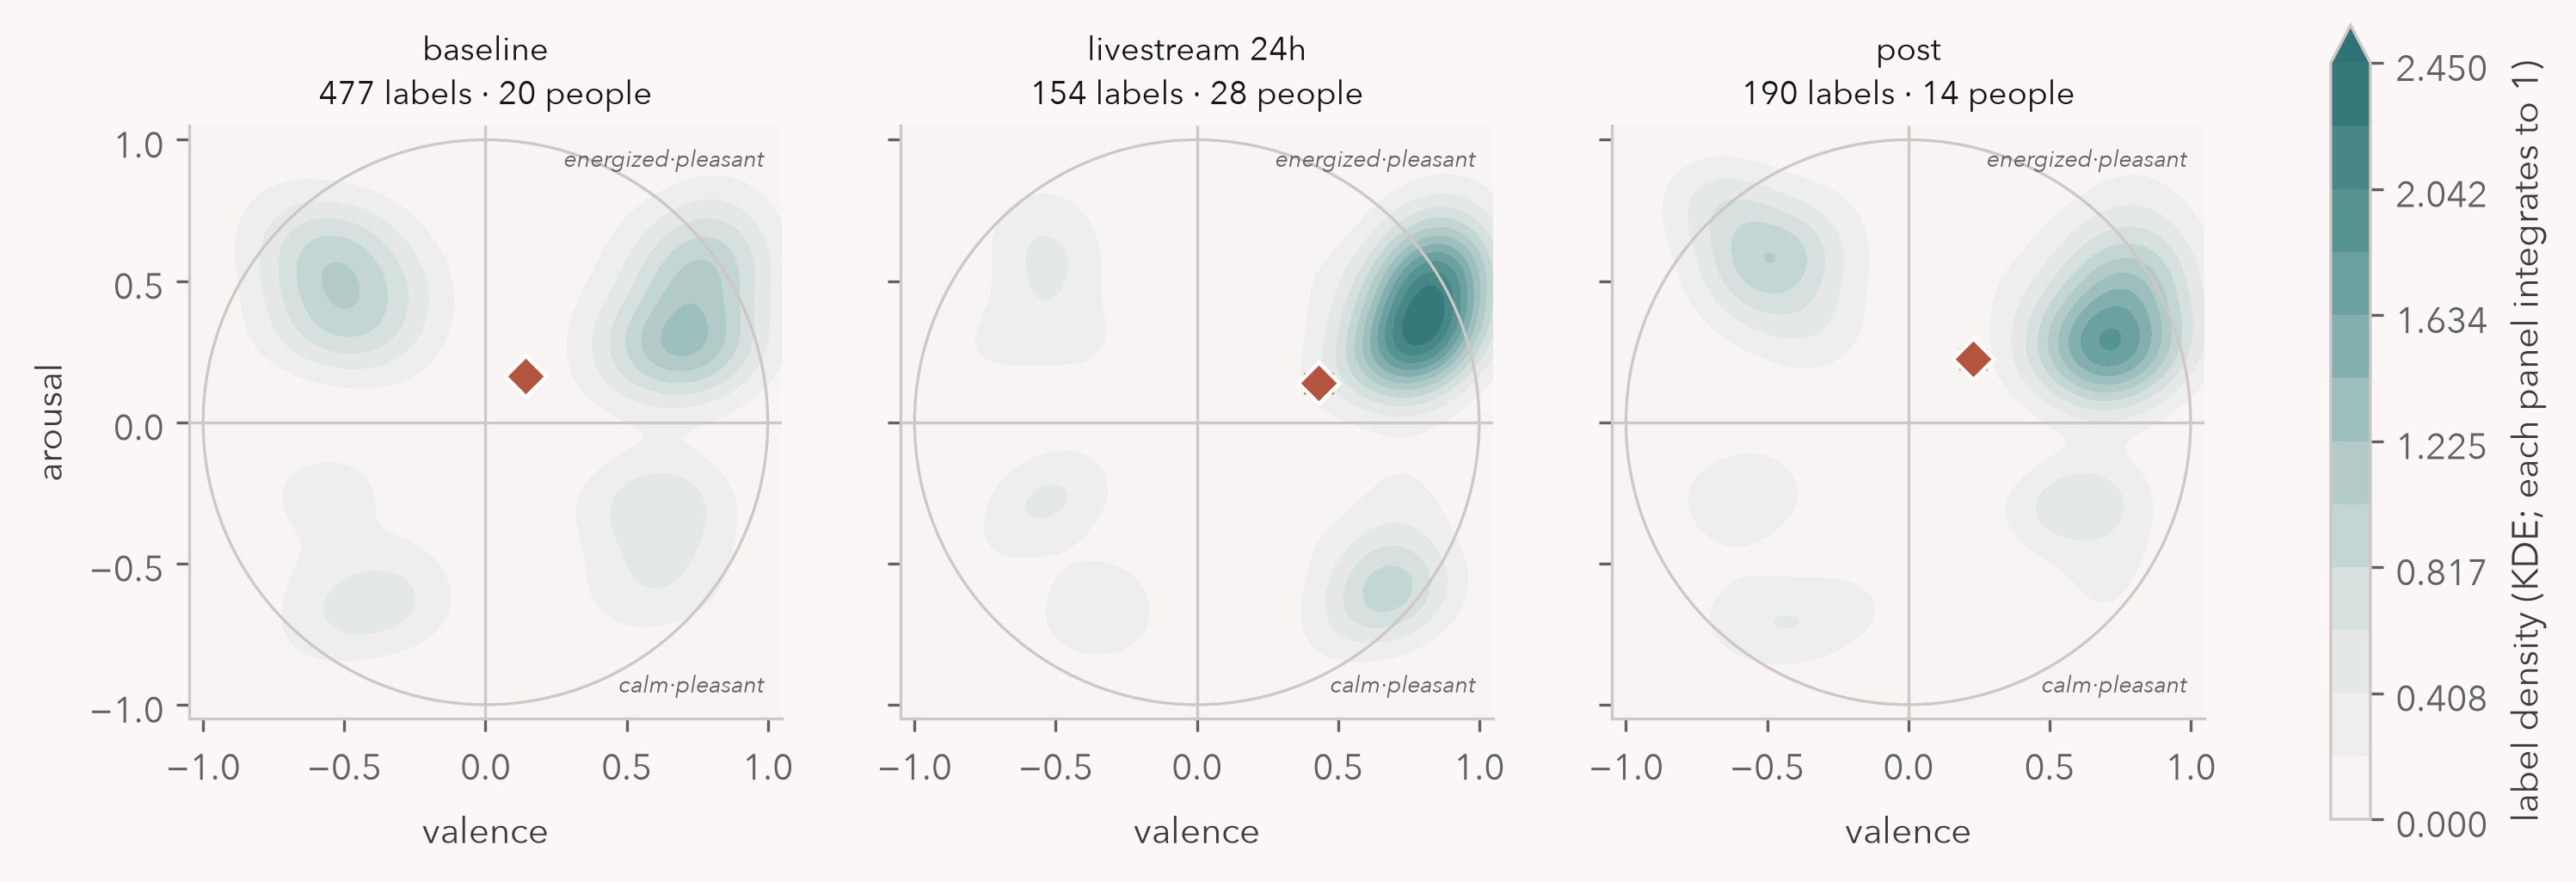
On the circumplex, the baseline distribution is bimodal: a frustration and tension cluster and a pleasant cluster. During the activation the unpleasant cluster mostly disappears and density concentrates around gratitude, love and joy. It returns afterwards. Mean arousal barely changed; the shift was in valence.
The index peaks during the meditation
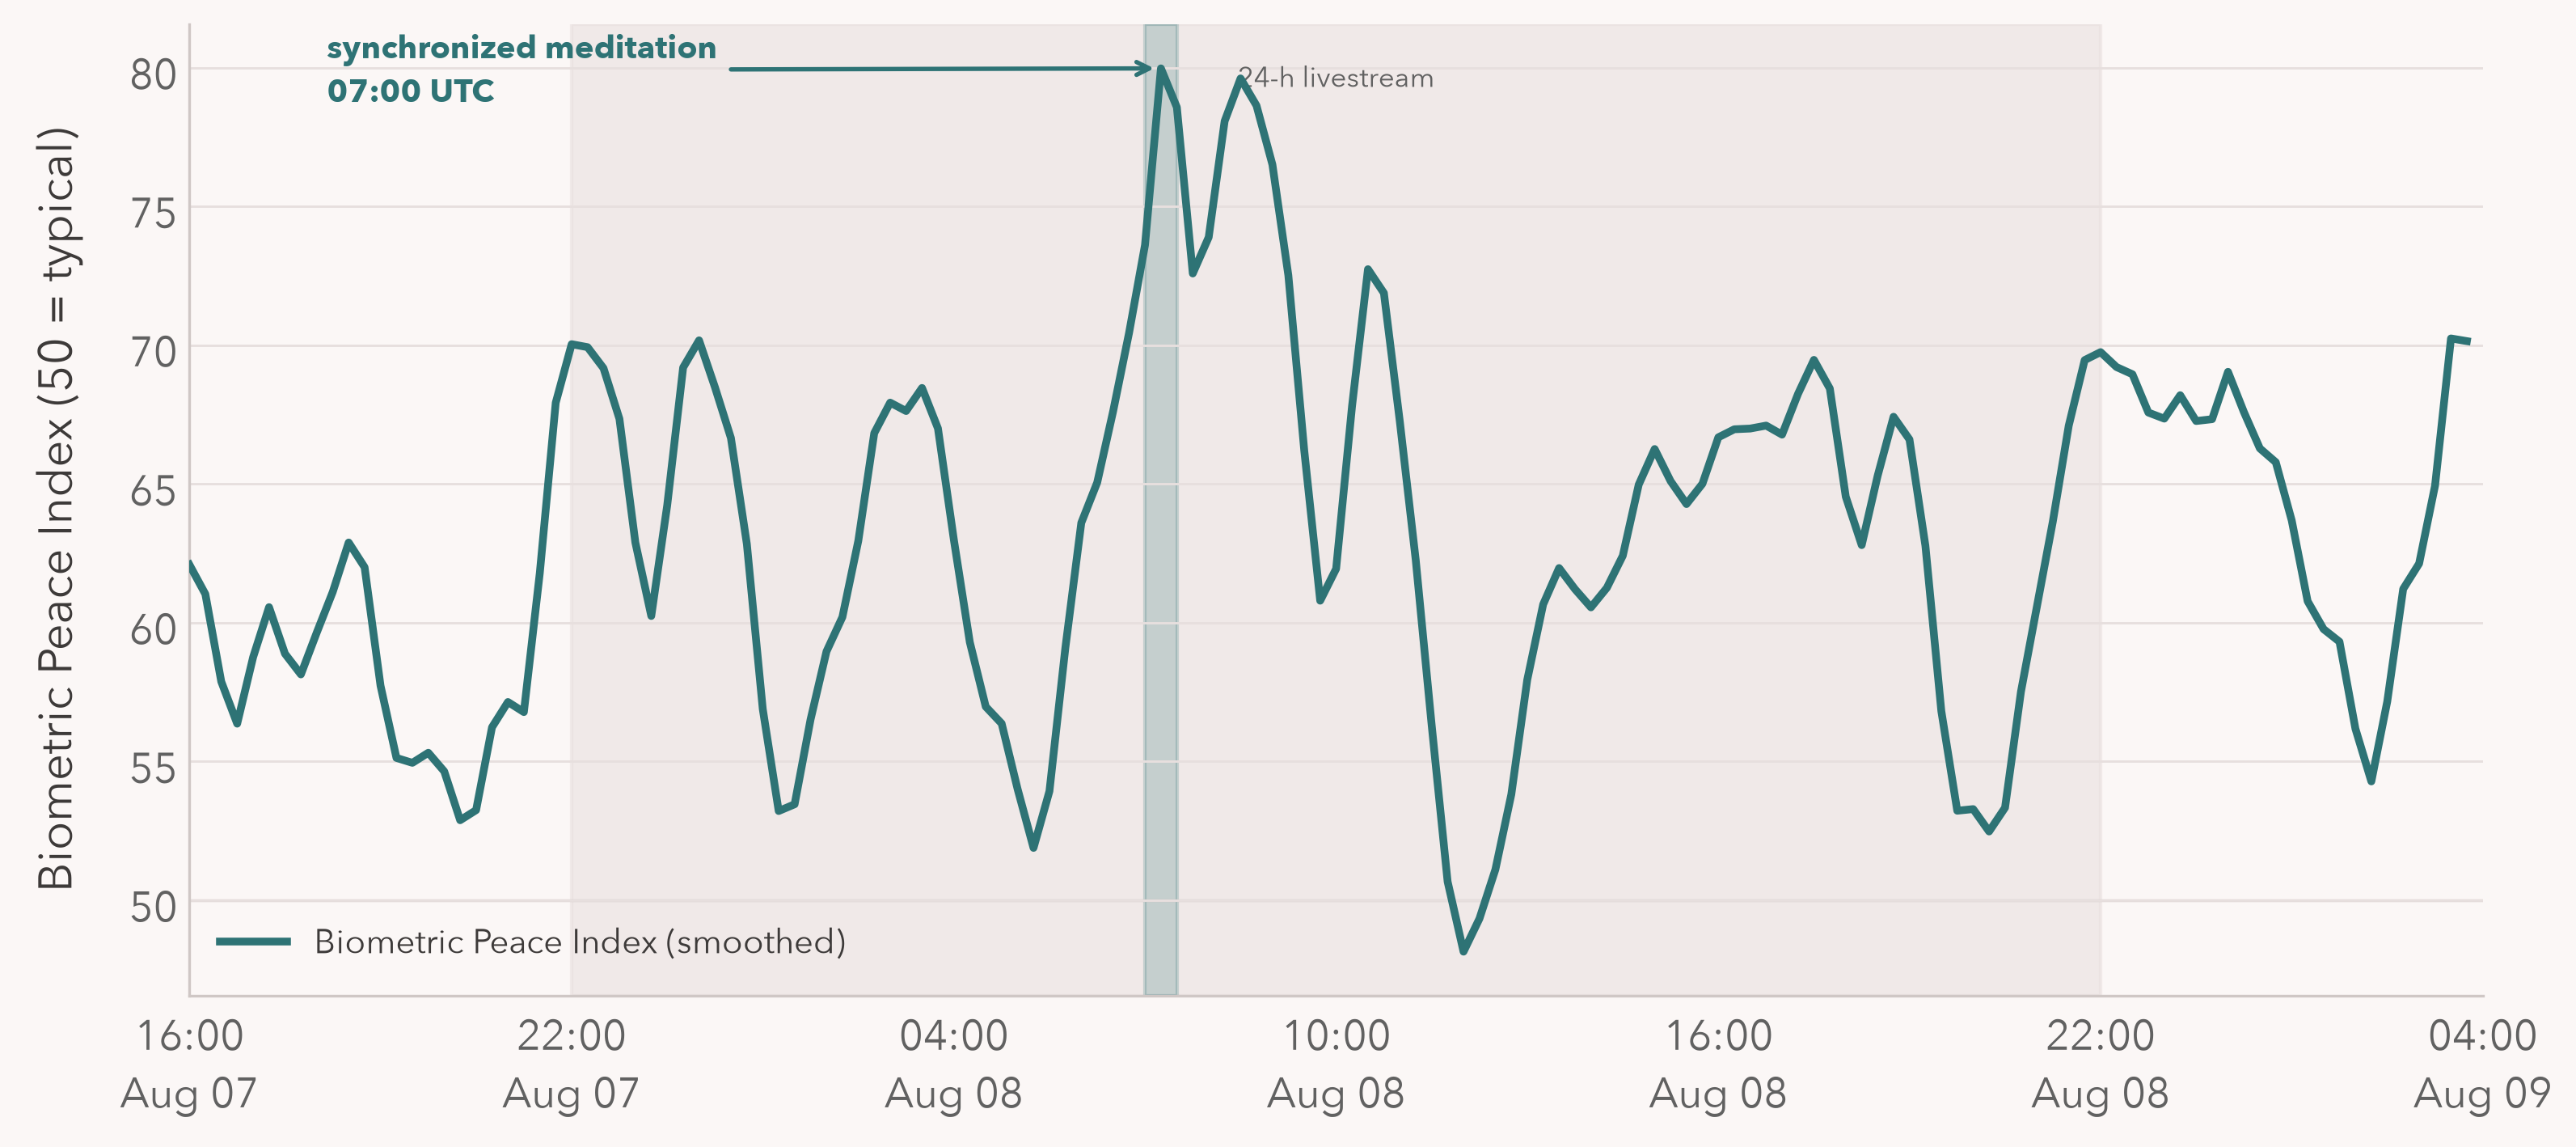
Combining the two lanes gives one time series. Over the 36 hours shown, the index ranges from the high 40s to the low 70s. During the synchronized meditation it reaches 80, the maximum of the span, and stays elevated for about two hours. The next highest stretch tops out near 73.
Later in the day, journaled emotion stayed pleasant (over 80% pleasant labels, against a typical 58% at those hours) but participants were more activated than usual, and the index settled in the 60s rather than returning to 80. Pleasant and activated is not peace, by design. The dip to 48 around 12:00 UTC is different: a drop in journaled pleasantness, not a rise in arousal.
Caveats
- This is observational. Nobody was randomized, so we can't attribute the changes to the meditation. What we can say is that physiology, journaled emotion and the combined index moved in the same direction at the same time.
- Sample sizes are small. 26 participants enter the physiology models, 18 can be scored on the calm lane (at most 15 at any one time), and 33 journaled within the span shown. Most participants joined at the event, so pre-event baselines are thin.
- The journalers before and during the event only partly overlap, so part of the 54% to 75% shift may be a change in who was writing.
- The index was built and tuned on this event, so this event can't validate it. It is robust to the analysis choices we tested (smoothing, window size, raw vs windowed labels), but the real test is a pre-registered replication on a new event.
What's next
A single event is a proof of concept. What we want is a continuous instrument: a live reading of how a population is doing, with causal models on top that estimate how specific events move it. Compare the observed trajectory against the counterfactual path without the event, and each event gets a measurable footprint.
We envision a metric that leaders can use to better understand the people they serve: how their own actions, the actions of others, and outside events land on their citizens. The same measurement works at any resolution. A local community, a city, a state, a country, or the globe, and the differences between them. It can also show how the same event affects different groups and communities differently, which a single national average would hide.
Peace is one direction on the circumplex. The same two inputs project onto any other direction, vitality or distress for example, so one pipeline yields a family of indices.
What we're looking for
The next step is a pre-registered replication at scale on the next event, and that requires data we don't have. We're looking for three kinds of partner:
- Continuous physiology at scale. A wearable cohort, a health system, a research panel.
- Live language data. Text at volume, in multiple languages, where people describe how they feel.
- Cohorts or events you run and want measured before, during and after.
We're flexible on structure: co-designed studies, data partnerships, shared authorship. If this is you, get in touch.